Peer-Reviewed Primer
Key Challenges for California's Energy Future
Overview
In 2022, CCST consulted with policymakers and more than 30 experts across California’s preeminent academic and research institutions to identify energy issues that needed additional attention given policy conversations and their importance to California’s clean energy future.
This process identified eight high-level key challenges, which are explored across the eight sections of this document. These sections highlight major challenges and opportunities, environmental justice and equity considerations, and resources for more information.
This peer-reviewed energy primer begins with an "Overview of California’s Energy Transition," prepared by the Steering Committee describing a framework for California’s energy transition and key highlights.

Read excerpts of each section below and download the primer to read them in full. Words in bold can be found in the document's Glossary section.
Overview of California’s Energy Transition
An overview authored by the Steering Committee describing a framework for California’s energy transition and key highlights.
The system of energy sources and applications we enjoy today has evolved over hundreds of years and has gone through multiple transformations over that period. Our complex energy system has many interacting technical and governance components. The current energy system emits greenhouse gases and causes other environmental impacts including air, water, and soil pollution. Low-income and communities of color disproportionately experience the negative impacts of our current energy system.
Motivated by the dire and mounting risks of climate change and opportunities for a more prosperous, just, and healthy California, we are in the midst of a rapid transition of our energy system and other aspects of our economy that contribute to greenhouse gas emissions. Strong, rapid action guided by careful, evidence-based, and inclusive planning can help minimize the impact of climate change while securing a safe, prosperous, and equitable future for all Californians.
At a high level, decarbonizing energy has three fundamental elements:
- Maximize efficiency and electrify energy use across sectors to the greatest extent possible.
- Provide affordable, accessible, and reliable carbon-free electricity for a highly electrified economy.
- Decarbonize activities that cannot be electrified by using clean fuels, efficiency, conservation, and better land use planning and infrastructure.
We are now entering an era of fundamental, large-scale structural changes to the energy system, during which the choices we make must ensure that the future energy system has adequate capacity and is both reliable and cost effective.
...
Continue reading the full overview online
1. Electrification and Grid Development
Grappling with an aging power grid and a rapidly expanding demand for electricity.
Overview
California’s decarbonization strategy calls for vehicle and building electrification*, but as more vehicles and homes are powered by electricity, there will be increasing demand placed on California’s grid. The California Air Resources Board (CARB) estimates that electricity demand could increase in the state by 76% by 2045 (relative to demand in 2022).1
The challenge of meeting these new demands comes alongside California’s concurrent transition to 100% renewable and zero-carbon resources as mandated by SB 100 (de León, 2018) and the integration of distributed energy resources like rooftop solar. These new and increasing demands require upgrades and expansion of a grid that is already challenged by wildfires, extreme heat, and weather events.2,3
Transmission infrastructure carries high-voltage electricity over long distances to distribution substations. These substations reduce the voltage and then transfer the power to distribution networks that deliver the lower voltage electricity over short distances to consumers. Both transmission and distribution infrastructure will need to be upgraded to accommodate additional demand and new energy resources. The California Independent System Operator (CAISO)—which oversees the operation of approximately 80% of California’s bulk electric power system, transmission lines, and electricity market—estimates that adding and upgrading transmission lines to meet predicted demand will cost $30.5 billion over the next 20 years.4
Download the Full Report to continue reading
--
Section topics:
- Increasing demand for electricity
- Changing energy supplies
- Reliability challenges
- Scale, impacts, and challenges of necessary grid infrastructure development
- Environmental Justice and Equity Considerations
- Relevant Policies
- Relevant State Institutions
-
1 California Air Resources Board. (2022). 2022 Scoping Plan for Achieving Carbon Neutrality. Available at: https://ww2.arb.ca.gov/sites/default/files/2022-11/2022-sp.pdf.
2 California ISO. (2022). California ISO extends Flex Alert to Thursday, Sept. 1. Available at: http://www.caiso.com/Documents/california-iso-extends-flex-alert-to-thursday-sept-1.pdf.
3 California ISO, California Public Utilities Commission, and California Energy Commission. (2021). Root Cause Analysis: Mid-August 2020 Extreme Heat Wave. Available at: http://www.caiso.com/Documents/Final-Root-Cause-Analysis-Mid-August-2020-Extreme-Heat-Wave.pdf.
4 California ISO. (2022). 20-Year Transmission Outlook. Available at: http://www.caiso.com/InitiativeDocuments/Draft20-YearTransmissionOutlook.pdf.
2. Utility-Scale Solar and Wind Development
Dramatically scaling California’s capacity to produce renewable energy without compromising the State’s natural and working lands.
Overview:
Approximately 28% of California’s energy is currently provided by utility-scale wind and solar facilities (as of 2022).42
SB 100 (de León, 2018) requires that by 2045, 100% of retail electricity will be provided by zero-carbon and renewable resources.
Many alternatives exist (e.g., geothermal, natural gas with carbon capture and storage, nuclear, hydro-, solar, and wind power). Due to low costs and high resource availability, solar and wind power will likely comprise the majority of California’s energy portfolio in a zero-carbon, renewable future.43
Distributed solar resources (e.g., rooftop solar) are and will continue to be important. Expanding this resource could avoid some of the impacts of utility-scale solar. However, these distributed resources will likely not meet all demand for renewable electricity. Further, utility-scale facilities are much more cost-effective than these small-scale applications.44 To meet predicted demand, unprecedented construction of utility-scale solar and wind facilities will be required.45
For example, California currently has 18 gigawatts (GW) of utility-scale solar;46 the SB 100 Joint Agency Report projects that an additional 70 GW of utility-scale solar will be required by 2045. Each GW of solar currently requires between 2,900 and 4,200 acres of land on average.47 The state is also committed to protecting and managing natural and working lands as a strategy for meeting the state’s goals for reducing greenhouse gas emissions (as per SB 1386, Wolk, 2016).
In siting utility-scale solar and wind, the state must consider clean energy needs, while also supporting other land use priorities such as agriculture, wildlife conservation, and recreation. New utility-scale solar often requires new transmission to deliver power to customers; this infrastructure presents its own siting challenges.
Download the Full Report to continue reading
--
Section topics:
- Wind and solar production
- Challenges to siting renewable facilities
- Possible synergies among land uses
- Environmental impacts of renewable energy installation
- Environmental Justice and Equity Considerations
- Relevant Policies
- Relevant State Institutions
-
42 Nyberg, M. (2023). 2022 Total System Electric Generation. California Energy Commission. Available at: https://www.energy.ca.gov/data-reports/energy-almanac/california-electricity-data/2022-total-system-electric-generation.
43 Gill, L., Gutierrez, A., and Weeks, T. (2021). 2021 SB 100 Joint Agency Report, Achieving 100 Percent Clean Electricity in California: An Initial Assessment. California Energy Commission, California Public Utilities Commission and California Air Resources Board. Publication number: CEC-200-2021-00. Available at: https://www.energy.ca.gov/publications/2021/2021-sb-100-joint-agency-report-achieving-100-percent-clean-electricity.
44 Ramasamy, V. et al. (2022). U.S. Solar Photovoltaic System and Energy Storage Cost Benchmarks, with Minimum Sustainable Price Analysis: Q1 2022 (No. NREL/TP-7A40-83586). National Renewable Energy Lab.
45 Gill, L., Gutierrez, A., and Weeks, T. (2021). 2021 SB 100 Joint Agency Report, Achieving 100 Percent Clean Electricity in California: An Initial Assessment. California Energy Commission, California Public Utilities Commission and California Air Resources Board. Publication number: CEC-200-2021-00. Available at: https://www.energy.ca.gov/publications/2021/2021-sb-100-joint-agency-report-achieving-100-percent-clean-electricity.
46 Nyberg, M. (2023). Electric Generation Capacity and Energy. Available at: https://www.energy.ca.gov/data-reports/energy-almanac/california-electricity-data/electric-generation-capacity-and-energy.
47 Bolinger, M., and Bolinger, G. (2022). Land Requirements for Utility-Scale PV: An Empirical Update on Power and Energy Density. IEEE Journal of Photovoltaics, 12(2), pp. 589-594.
3. Reliability and the Need for Clean, Firm Power
Managing the intermittency of renewable resources.
Overview:
Wind and solar resources are integral to California’s path to decarbonization, but these weather- and season-dependent resources introduce reliability challenges. To cost-effectively resolve these challenges and still meet net-zero by 2045 (as per AB 1279, Muratsuchi, 2022), the state will need clean, firm power—carbon-neutral power that can be delivered for as long as needed in the amount needed.
Utility-scale wind and solar currently comprise the majority (74%) of California’s portfolio of renewable energy.96 In 2022, 26.8% of the total electricity generated in-state came from these intermittent renewable resources (19.9% and 6.9% from solar and wind, respectively).97 Moreover, demand for electricity is expected to increase 76% (relative to demand in 2022) by 2045 as a result of population growth and electrification efforts.98
Energy storage, demand response, and grid regionalization can alleviate some—but not all—of the challenges associated with intermittent renewable resources. A diverse portfolio that also includes clean, firm power—be it geothermal, nuclear, renewable hydrogen, natural gas with carbon capture and storage, or something else—would address seasonal fluctuations and extreme weather events and is predicted to result in significantly reduced system costs and therefore lower electricity rates.
Download the Full Report to continue reading
--
Section topics:
- The nature of renewable intermittency
- Batteries and other energy storage
- Demand response
- Coordination across states
- Clean firm power options
- Geothermal energy
- Nuclear power
- Hydropower
- Natural gas with carbon capture and storage
- Hydrogen
- Environmental Justice and Equity Considerations
- Relevant Policies
- Relevant State Institutions
-
96 Nyberg, M. (2023). 2022 Total System Electric Generation. California Energy Commission. Available at: https://www.energy.ca.gov/data-reports/energy-almanac/california-electricity-data/2022-total-system-electric-generation.
97 Nyberg, M. (2023). 2022 Total System Electric Generation. California Energy Commission. Available at: https://www.energy.ca.gov/data-reports/energy-almanac/california-electricity-data/2022-total-system-electric-generation.
98 California Air Resources Board. (2022). 2022 Scoping Plan for Achieving Carbon Neutrality. Available at: https://ww2.arb.ca.gov/sites/default/files/2022-11/2022-sp.pdf.
4. Decentralizing the Grid
Deploying, integrating, and coordinating distributed energy resources to improve energy resilience.
Overview:
California’s power grid—which is more than a century old in some places—is challenged by the growth in energy demand, addition of renewable resources, and increasingly common extreme heat and wildfires.
If effectively leveraged, distributed energy resources (DERs) can help enhance energy resilience for consumers and the grid at large. This umbrella term includes small-scale energy resources—like rooftop solar panels, back-up generators, and batteries—that either store or generate energy and that are usually behind-the-meter (as opposed to utility-scale energy resources like power plants). DERs also include technologies that help reduce or shift energy demand (i.e., demand response and energy efficiency).
California is embarking on plans to modernize the electric grid by further integrating and coordinating these distributed resources.155 However, California’s grid operators and electric utilities have numerous hurdles to overcome if they are to fully realize the benefits of DERs.
For example, transitioning from California’s historically centralized grid—whereby power is generated by a small number of large power plants and then transmitted across long distances to consumers across the state—to a more decentralized grid that also draws power from innumerable DERs will take a fundamental shift in grid management and introduces numerous challenges.
Download the Full Report to continue reading
--
Section topics:
- DERs defined
- Distributed solar power
- Distributed battery storage
- Demand response
- Battery electric vehicles
- Energy efficiency
- Challenges
- Coordinating DERs: Strength in numbers
- Supporting distributed energy resources in California
- Net energy metering
- Environmental Justice and Equity Considerations
- Relevant Policies
- Relevant State Institutions
-
155 California Public Utilities Commission. (2021). Order Institute Rulemaking to Modernize the Electric Grid for a High Distributed Energy Resources Future. Available at: https://docs.cpuc.ca.gov/PublishedDocs/Published/G000/M382/K451/382451995.PDF.
5. Carbon Capture and Storage
Capturing difficult-to-mitigate emissions.
Overview:
Carbon capture and storage* (CCS) is the process of capturing, compressing, transporting, and sequestering carbon dioxide (CO2). Most proposed applications for CCS involve capturing CO2 that would have otherwise been released into the atmosphere during industrial processes, particularly fuel combustion. However, new applications are emerging that remove CO2 from ambient air (known as “direct air capture” or DAC). The captured carbon can then be sequestered in geologic formations (see Figure 5.1). A small fraction could also be used for other industrial applications (like concrete, fuels, or plastic). Much of the cost and complexity of CCS relates to separating CO2 from other gases, especially oxygen and nitrogen.199 Where CO2 is present in higher concentrations, this separation is typically easier and less expensive.
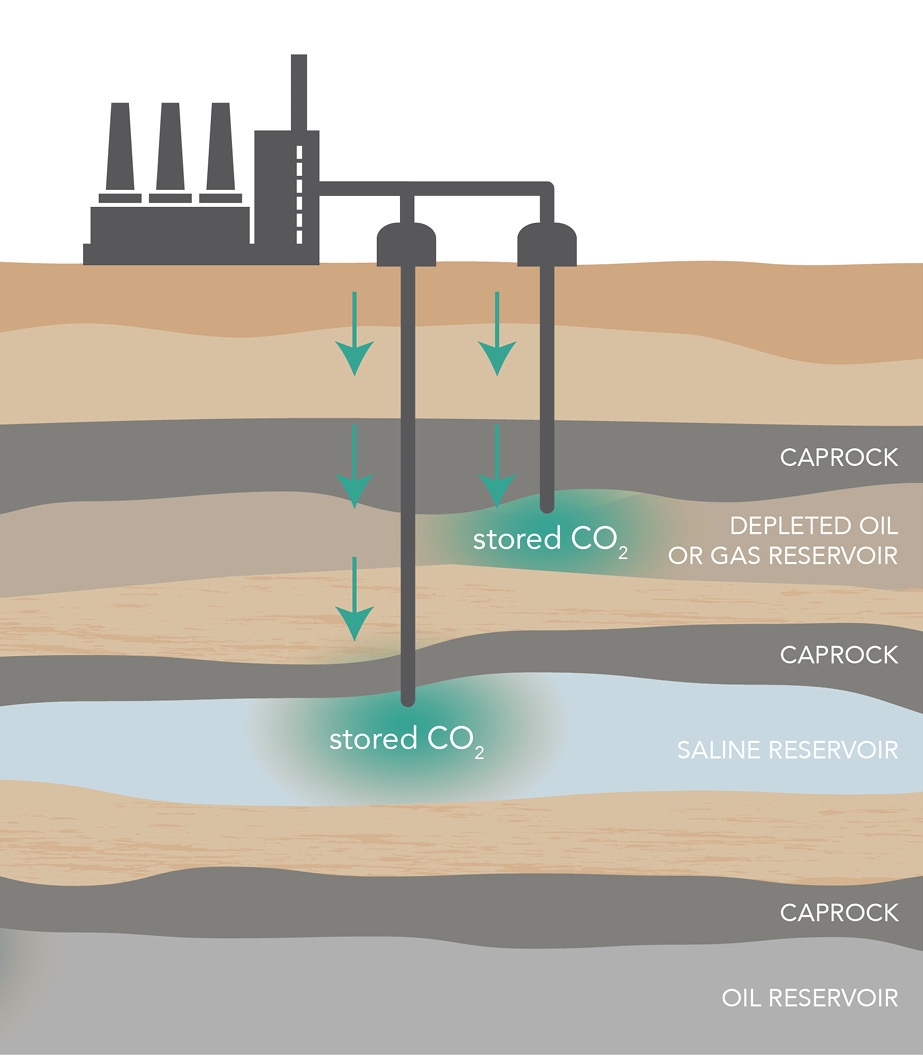
Available at: https://ww2.arb.ca.gov/our-work/programs/carbon-capture-sequestration/about.
In its proposed scenario for reaching a net-zero economy by 2045 (as per AB 1279, Muratsuchi, 2022, 2022), the California Air Resources Board (CARB) includes CCS—and DAC—to limit emissions and minimize leakage from hard-to-decarbonize sectors.200 This aligns with the findings of multiple studies on climate change that have found few, if any, feasible trajectories to climate stabilization without significant amounts of CCS.201
CCS deployment has historically been slow, but the pace is quickening. Globally, just over 40 commercial CCS facilities are operational, but 142 are either being constructed or at an advanced stage of development.202 Early CCS projects have produced mixed results: many have been in continuous operation for several years, but others have closed or been cancelled due to both technical and economic challenges.
The extent to which California should rely on CCS to achieve its emissions reduction goals has generated much debate. Opponents argue that CCS does not achieve the emissions reductions promised, prolongs the life of polluting industries that are often located in disadvantaged communities, and distracts from opportunities for direct emissions reductions.
Download the Full Report to continue reading
--
Section topics:
- CCS in California
- Carbon capture rates
- Potential risks
- Environmental Justice and Equity Considerations
- Relevant Policies
- Relevant State Institutions
-
199 Congressional Research Service. (2022). Carbon Capture and Sequestration in the United States. Available at: https://sgp.fas.org/crs/misc/R44902.pdf.
200 California Air Resources Board. (2022). 2022 Scoping Plan for Achieving Carbon Neutrality. Available at: https://ww2.arb.ca.gov/sites/default/files/2022-11/2022-sp.pdf.
201 Intergovernmental Panel on Climate Change. (2022). Summary of the 56th Session of the Intergovernmental Panel on Climate Change and the 14th Session of Working Group III: 21 March - 4 April 2022. Earth Negotiations Bulletin, 12(795), pp. 1-32.
202 International Energy Agency. (2023). Carbon Capture, Utilisation and Storage. Accessed on 10/19/2023 at: https://www.iea.org/energy-system/carbon-capture-utilisation-and-storage.
6. The Future of the Natural Gas System
Reducing natural gas consumption to meet climate and air quality laws while ensuring a reliable energy supply.
Overview:
More natural gas is consumed in California than in any other state except Texas. Of all natural gas consumed in state, approximately 32% is used to generate electricity; 33% is used in industry; 22% is used for residential purposes (e.g., heating and cooking); 12% is used for commercial applications; and 1% is used for vehicle fuel (Figure 6.1).247 Approximately 36% of California’s power is derived from natural gas (as of 2022).248 However, meeting the State’s climate and air quality laws requires nearly eliminating consumption of natural gas—other than at facilities with carbon capture and storage (CCS)—by 2045.

Available at: https://www.eia.gov/dnav/ng/ng_cons_sum_dcu_SCA_a.htm.
Policies are being implemented that reduce California’s dependence on natural gas due to its impacts on climate and health (via electrification, increasing energy efficiency, building more renewable resources, etc.). Between 2001 and 2022, in-state natural gas use declined by 15%249 despite a 14% increase in population over the same period.250 The California Energy Commission (CEC) predicts close to another 12% reduction by 2035 (relative to 2020 levels).251
Currently, natural gas is most commonly used as an energy carrier for heat production. Renewable electricity can replace natural gas in most of these applications. However, some current uses of natural gas—particularly for firm power (i.e., power that can be delivered for as long as needed in the amount needed) and as a feedstock for chemical industries—may not be feasible to replace with renewable electricity. The key challenges for policymakers will be to transition most natural gas uses to lower-carbon alternatives while preserving the capacity to supply the hard-to-replace sectors and reducing the environmental impacts of natural gas extraction, distribution, and use, particularly methane leaks and air pollution caused by natural gas combustion.
Download the Full Report to continue reading
--
Section topics:
- Climate, health, and safety impacts
- Decarbonizing buildings
- Natural gas infrastructure
- Meeting electricity demand
- Reducing carbon intensity
- Environmental Justice and Equity Considerations
- Relevant Policies
- Relevant State Institutions
-
247 U.S. Energy Information Administration. (2022). California Natural Gas Consumption by End Use. Independent Statistics & Analysis. Accessed on 11/01/2022 at: https://www.eia.gov/dnav/ng/ng_cons_sum_dcu_SCA_a.htm.
248 California Energy Commission. (2023). 2022 Total System Electric Generation. California Energy Commission. Available at: https://www.energy.ca.gov/data-reports/energy-almanac/california-electricity-data/2022-total-system-electric-generation.
249 U.S. Energy Information Administration. (2022). Natural Gas Delivered to Consumers in California (Including Vehicle Fuel). Accessed on 11/22/2022 at: https://www.eia.gov/dnav/ng/hist/n3060ca2m.htm.
250 USA Facts. (2022). Our Changing Population: California. Accessed on 12/15/2022 at: https://usafacts.org/data/topics/people-society/population-and-demographics/our-changing-population/state/california?endDate=2021-01-01&startDate=2001-01-01.
251 Javanbakht, H. et al. (2022). Final 2021 Integrated Energy Policy Report, Volume IV: California Energy Demand Forecast. California Energy Commission. Publication Number: CEC-100- 2021-001-V4. Available at: https://efiling.energy.ca.gov/GetDocument.aspx?tn=241581
7. Decarbonizing Transportation
Transitioning to zero-emission vehicles and reducing vehicle miles traveled.
Overview:
The transportation sector accounts for about 38%300 of California’s greenhouse gas (GHG) emissions (50% if including emissions from fuel production), 80% of smog-forming nitrogen oxide emissions, and 95% of diesel particulate matter emissions.301
Achieving net-zero GHG emissions by 2045 (as per AB 1279, Muratsuchi, 2022) requires the vast majority of the transportation sector to transition to vehicles that can be powered by zero, or near-zero carbon energy. Zero-emission vehicles (ZEVs) probably cannot satisfy every transportation demand, so California has adopted a portfolio approach to decarbonizing the transportation sector.
Critical complementary strategies include supporting markets for low- and carbon-free fuels, improving access to active transportation through safe pedestrian and bicycle pathways, optimizing city planning, and mitigating barriers to public transportation and decarbonization technologies in lower income and rural communities.
The transition to carbon-neutral transportation is likely to provide significant co-benefits, including improvements to air pollution, public health, environmental equity, and economic development.
Download the Full Report to continue reading
--
Section topics:
- Decarbonizing vehicles and fuels
- Zero-emission vehicles (ZEVs)
- Supporting the electric vehicle transition
- Low-carbon fuels
- Reducing vehicle miles traveled
- Environmental Justice and Equity Considerations
- Relevant Policies
- Relevant State Institutions
-
300 California Air Resources Board. (2022). Current California GHG Emission Inventory Data. Accessed on 10/17/2023 at: https://ww2.arb.ca.gov/ghg-inventory-data.
301 California Air Resources Board. (2021). Advanced Clean Trucks: Accelerating Zero-Emission Truck Markets. Accessed on 12/01/2022 at: https://ww2.arb.ca.gov/sites/default/files/2021-08/200625factsheet_ADA.pdf.
8. Cap-and-Trade
Leveraging market mechanisms to incentivize decarbonization through 2030 (and beyond?)
Overview:
As part of its implementation of AB 32 (Nunez, 2006), the California Air Resources Board (CARB) launched the statewide Cap-and-Trade Program in late 2012. The program initially covered greenhouse gases (GHGs)—including carbon dioxide (CO2), methane (CH4), and nitrous oxide (N2O)—produced by the industrial and electricity sectors. Emissions associated with transportation fuels and natural gas distributors were added to the program in 2015.
Currently about 80% of statewide emissions are covered by the cap, including emissions from electricity imports and fuel imported and consumed in the state.350
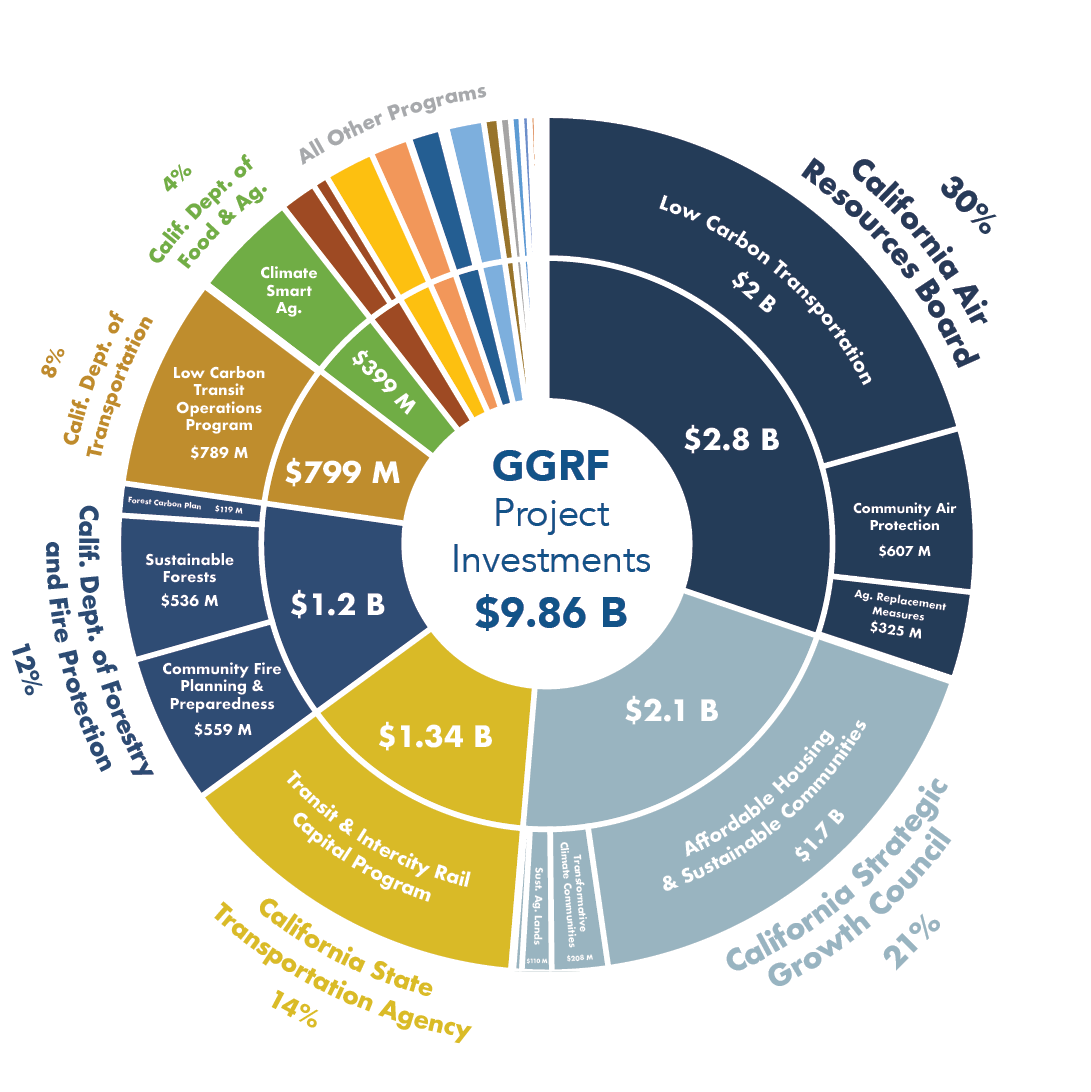
As a result of implementation decisions, the direct contributions of Cap-and-Trade to emission reductions achieved in California are suspected to be modest in comparison with other programs.351 Proceeds from the Cap-and-Trade auction are deposited into the Greenhouse Gas Reduction Fund (GGRF). The GGRF supports programs that contribute to additional emission reductions (see Figure 8.1).352 The future role of Cap-and-Trade in driving emission reductions through 2030 (when the program is currently set to expire) is uncertain depending in part on the performance of complementary programs. Analysts have cautioned that excessive banked allowances jeopardize California’s ability to reach 2030 emission reduction targets.353,354
Compared to the 2017 Scoping Plan, CARB’s 2022 Scoping Plan predicts a much more modest role for Cap-and-Trade in driving future reductions in GHG emissions. However, the Independent Emissions Market Advisory Committee—established by AB 398 (Eduardo Garcia, 2017) to analyze the performance of Cap-and-Trade—has recommended several reforms that could make the program play a larger role in driving emission reductions.
Facilities regulated by Cap-and-Trade are disproportionately located in communities with greater numbers of residents of color and residents living in poverty. Environmental justice advocates argue the program inadequately addresses pollution in these communities, because it does not require these facilities to directly reduce emissions if the operating firms satisfy their compliance obligations in other ways.
Download the Full Report to continue reading
--
Section topics:
- Cap-and-Trade Fundamentals
- Challenges
- Environmental Justice and Equity Considerations
- Relevant Policies
- Relevant State Institutions
-
350 California Air Resources Board. (2022). Mandatory Greenhouse Gas Reporting, 2021 Emissions Year Frequently Asked Questions. Available at: https://ww2.arb.ca.gov/sites/default/files/classic/cc/reporting/ghg-rep/reported-data/2021mrrfaqs.pdf.
351 Legislative Analyst’s Office. (2019). Assessing California’s Climate Policies. Available at: https://lao.ca.gov/handouts/resources/2019/Assessing-California-Climate-Policies-022019.pdf.
352 California Climate Investments. (2023). 2023 Annual Report: Cap-and-Trade Auction Proceeds. Available at: https://ww2.arb.ca.gov/sites/default/files/auction-proceeds/cci_annual_report_2023.pdf.
353 Legislative Analyst’s Office. (2017). Cap-and-Trade Extension: Issues for Legislative Oversight. Available at: https://lao.ca.gov/Publications/Report/3719.
354 Burtraw, D. et al. (2022). 2021 Annual Report of the Independent Emissions Market Advisory Committee. Available at: https://calepa.ca.gov/wp-content/uploads/sites/6/2022/01/2021-IEMAC-Annual-Report.a.pdf.
Glossary
Related News Stories
The California Council on Science and Technology Celebrates the 30th Anniversary of Its Establishment Via the California State Legislature
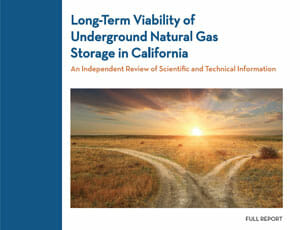
CCST Report Assesses the Long-Term Viability of Underground Natural Gas Storage in California
2010 CCST Science Fellow Ryan McCarthy Is Keynote Speaker at Renewable Natural Gas Symposium, May 17th
California Council on Science and Technology and Berkeley Lab Release Scientific Assessment of Hydraulic Fracturing in California

Our Mission
To engage leading experts in science and technology to advise State policymakers - ensuring that California policy is strengthened and informed by scientific knowledge, research, and innovation.